Prometheus 监控告警:基于 SLO 的告警设计
Prometheus 监控告警:基于 SLO 的告警设计
引言
在传统的监控告警中,我们往往为每个指标单独设置阈值:CPU 使用率>80%、内存>90%、延迟>500ms。然而,这种指标驱动的告警方式存在明显问题:
❌ 传统监控的痛点:
- 告警风暴:大量指标触发告警,难以区分优先级
- 业务不相关:技术指标正常但用户仍受影响
- 缺乏上下文:不知道这些告警对业务的影响
- 难以决策:收到告警后不知该如何响应
✅ SLO 告警的优势:
- 业务导向:直接关联用户体验
- 优先级清晰:基于错误预算燃烧速率
- 告警数量少:只关注关键问题
- 可预测:提前发现长期趋势问题
SLO、SLI、SLA 概念:
| 术语 | 全称 | 说明 |
|---|---|---|
| SLI | Service Level Indicator | 服务等级指标(如请求成功率) |
| SLO | Service Level Objective | 服务等级目标(如成功率>99.9%) |
| SLA | Service Level Agreement | 服务等级协议(承诺给用户的目标) |
适用场景:
- 🌐 Web API 可用性监控
- 📊 数据库性能监控
- 💾 缓存服务监控
- 🔔 告警风暴治理
- 📈 业务稳定性评估
适用读者: 运维工程师、SRE、后端开发工程师
—
SLO 基础
1. SLI 定义
SLI 是衡量服务健康度的指标。常见 SLI 类型:
“`promql
可用性 SLI(请求成功率)
requests_success / requests_total
延迟 SLI(请求延迟)
histogram_quantile(0.95, rate(http_request_duration_seconds_bucket[5m]))
吞吐量 SLI(每秒请求数)
rate(http_requests_total[5m])
完整性 SLI(数据完整性)
valid_records / total_records
2. SLO 设计原则

错误预算(Error Budget):
错误预算 = 100% – SLO
示例:99.9% 可用性的 SLO
- 错误预算 = 0.1%
- 每月允许错误时间 = 30 天 × 24 小时 × 60 分钟 × 0.1%
- = 43.2 分钟/月
错误预算燃烧速率:
promql
错误预算消耗速率(当前错误率 / 允许的错误率)
(rate(http_requests_total{status=~”5..”}[5m])
/
rate(http_requests_total[5m]))
/
0.001 # 0.1% 错误率
3. SLO 监控目标
yaml
示例:Web API 的 SLO
api_slo:
name: “API 可用性”
objective: 0.999 # 99.9% 可用性
period: 30d # 月度评估
slis:
- name: “请求成功率”
metric: http_requests_total
success_condition: status!~”5..”
---

Prometheus 配置

1. 录制规则(Recording Rules)

录制规则用于预先计算复杂查询,提升查询性能。
yaml
prometheus-recording-rules.yml
groups:
- name: slo-recording-rules
interval: 30s
rules:
# 计算每秒请求率
- record: http_requests:rate5m
expr: sum(rate(http_requests_total[5m])) by (service, method, path)
# 计算错误率
- record: http_errors:rate5m
expr: sum(rate(http_requests_total{status=~”5..”}[5m])) by (service, method, path)
# 计算成功率
- record: http_success_rate:rate5m
expr: |
1 – (
sum(rate(http_requests_total{status=~”5..”}[5m])) by (service, method, path)
/
sum(rate(http_requests_total[5m])) by (service, method, path)
)
# 计算错误预算消耗速率
- record: http_error_budget_burn_rate:5m
expr: |
(
sum(rate(http_requests_total{status=~”5..”}[5m])) by (service)
/
sum(rate(http_requests_total[5m])) by (service)
)
/
(1 – 0.999) # 0.1% 错误率
2. 告警规则(Alerting Rules)
yaml
prometheus-alerts-slo.yml
groups:
- name: slo-alerts
interval: 1m
rules:
# 错误预算快速燃烧告警
- alert: ErrorBudgetBurnRateHigh
expr: |
http_error_budget_burn_rate:5m{service=~”.+”} > 2
for: 5m
labels:
severity: critical
team: ‘{{ $labels.team }}’
annotations:
summary: |
[{{ $labels.service }}] 错误预算燃烧过快
description: |
服务 {{ $labels.service }} 的错误预算正在快速消耗。
当前燃烧速率:{{ $value | humanizePercentage }}/秒
预计 {{ $value | humanizeDuration }} 后耗尽当前错误预算。
runbook_url: https://wiki.internal/runbooks/slo-burn-rate
# 长期趋势告警
- alert: ErrorBudgetDepleting
expr: |
rate(http_requests_total{status=~”5..”}[1h]) /
rate(http_requests_total[1h]) > 0.001
for: 4h
labels:
severity: warning
team: ‘{{ $labels.team }}’
annotations:
summary: |
[{{ $labels.service }}] 错误预算持续消耗
description: |
服务 {{ $labels.service }} 在 1 小时内持续消耗错误预算。
当前错误率:{{ $value | humanizePercentage }}
预计 30 天内将耗尽错误预算。
runbook_url: https://wiki.internal/runbooks/slo-depleting
# 瞬时错误率告警
- alert: HighErrorRate
expr: |
rate(http_requests_total{status=~”5..”}[5m]) >
rate(http_requests_total{status=~”5..”}[1h]) * 3
for: 5m
labels:
severity: critical
team: ‘{{ $labels.team }}’
annotations:
summary: |
[{{ $labels.service }}] 错误率突增
description: |
服务 {{ $labels.service }} 的错误率突然增加。
当前 5 分钟错误率:{{ $value | humanizePercentage }}
相比 1 小时平均值增长 3 倍以上。
runbook_url: https://wiki.internal/runbooks/high-error-rate
# 错误预算即将耗尽告警
- alert: ErrorBudgetNearExhaustion
expr: |
(
sum(increase(http_requests_total{status=~”5..”}[30d])) by (service)
/
sum(increase(http_requests_total[30d])) by (service)
) > 0.0005
for: 1d
labels:
severity: warning
team: ‘{{ $labels.team }}’
annotations:
summary: |
[{{ $labels.service }}] 错误预算即将耗尽
description: |
服务 {{ $labels.service }} 在过去 30 天内已使用超过 50% 的错误预算。
当前错误率:{{ $value | humanizePercentage }}
剩余错误预算不足。
runbook_url: https://wiki.internal/runbooks/slo-exhaustion
---

实战案例

1. Web API 服务 SLO 监控
yaml
定义 Web API 的 SLO
groups:
- name: api-slo
rules:
# 计算 API 请求成功率
- record: api:success_rate:5m
expr: |
1 – (
sum(rate(http_requests_total{job=”api”,status=~”5..”}[5m]))
/
sum(rate(http_requests_total{job=”api”}[5m]))
)
# 计算 API 错误预算
- record: api:error_budget_remaining:30d
expr: |
(
1 – 0.999 # SLO 目标
) – (
(
sum(increase(http_requests_total{job=”api”,status=~”5..”}[30d]))
/
sum(increase(http_requests_total{job=”api”}[30d]))
)
)
# API 错误预算燃烧告警
- alert: APISLOErrorBudgetBurn
expr: |
(
sum(rate(http_requests_total{job=”api”,status=~”5..”}[5m]))
/
sum(rate(http_requests_total{job=”api”}[5m]))
)
/
0.001 > 2
for: 5m
annotations:
summary: “API 错误预算燃烧过快”
description: “API 服务错误预算燃烧速率超过阈值”
2. 数据库服务 SLO 监控
yaml
定义数据库的 SLO
groups:
- name: database-slo
rules:
# 计算数据库连接成功率
- record: db:connection_success_rate:5m
expr: |
sum(increase(mysql_global_status_connections{status=”accepted”}[5m]))
/
sum(increase(mysql_global_status_connections[5m]))
# 计算数据库慢查询率
- record: db:slow_query_rate:5m
expr: |
sum(rate(mysql_global_status_slow_queries[5m]))
/
sum(rate(mysql_global_status_questions[5m]))
# 计算数据库错误预算
- record: db:error_budget_remaining:30d
expr: |
(
1 – 0.9999 # 99.99% 可用性 SLO
) – (
sum(increase(mysql_global_status_errors_total[30d]))
/
sum(increase(mysql_global_status_commands_total[30d]))
)
# 数据库连接错误率告警
- alert: DatabaseConnectionErrorRate
expr: |
(
sum(rate(mysql_global_status_errors_total[5m]))
/
sum(rate(mysql_global_status_connections[5m]))
)
/
0.0001 > 3
for: 5m
annotations:
summary: “数据库连接错误率异常”
description: “数据库连接错误率超出 SLO 阈值”
3. 缓存服务 SLO 监控
yaml
定义缓存服务的 SLO
groups:
- name: cache-slo
rules:
# 计算缓存命中率
- record: cache:hit_rate:5m
expr: |
sum(rate(redis_hits_total[5m]))
/
(
sum(rate(redis_hits_total[5m]))
+
sum(rate(redis_misses_total[5m]))
)
# 计算缓存延迟
- record: cache:latency:p99:5m
expr: |
histogram_quantile(0.99,
rate(redis_command_duration_seconds_bucket[5m])
)
# 计算缓存错误预算
- record: cache:error_budget_remaining:30d
expr: |
(
1 – 0.995 # 99.5% 命中率 SLO
) – (
1 – (
sum(rate(redis_hits_total[30d]))
/
(
sum(rate(redis_hits_total[30d]))
+
sum(rate(redis_misses_total[30d]))
)
)
)
# 缓存命中率下降告警
- alert: CacheHitRateLow
expr: |
(
sum(rate(redis_hits_total[5m]))
/
(
sum(rate(redis_hits_total[5m]))
+
sum(rate(redis_misses_total[5m]))
)
)
< 0.99
for: 10m
annotations:
summary: "缓存命中率低于 SLO"
description: "缓存命中率低于 99%,可能影响性能"
---

告警策略

1. 错误预算燃烧告警
yaml
groups:
- name: error-budget-burn
rules:
# 快速燃烧(2 倍速率,持续 5 分钟)
- alert: ErrorBudgetBurnRateHigh
expr: |
rate(http_requests_total{status=~”5..”}[5m])
/ rate(http_requests_total[5m])
/ (1 – 0.999) > 2
for: 5m
labels:
severity: critical
annotations:
summary: “[{{ $labels.service }}] 错误预算快速燃烧”
description: “错误预算以 {{ $value | humanize }} 倍速度消耗”
# 中速燃烧(1.5 倍速率,持续 30 分钟)
- alert: ErrorBudgetBurnRateMedium
expr: |
rate(http_requests_total{status=~”5..”}[5m])
/ rate(http_requests_total[5m])
/ (1 – 0.999) > 1.5
for: 30m
labels:
severity: warning
annotations:
summary: “[{{ $labels.service }}] 错误预算中等燃烧”
description: “错误预算以 {{ $value | humanize }} 倍速度消耗”
2. 长期趋势告警
yaml
groups:
- name: error-budget-trend
rules:
# 30 天内错误率超出阈值
- alert: ErrorBudgetExhaustionWarning
expr: |
(
sum(increase(http_requests_total{status=~”5..”}[30d]))
/
sum(increase(http_requests_total[30d]))
) > 0.0005 # 50% 错误预算已用
for: 1d
labels:
severity: warning
annotations:
summary: “[{{ $labels.service }}] 错误预算使用过半”
description: “30 天内已使用 50% 错误预算,需要关注”
# 剩余 1 周错误预算
- alert: ErrorBudgetCritical
expr: |
(
sum(increase(http_requests_total{status=~”5..”}[7d]))
/
sum(increase(http_requests_total[7d]))
) > 0.00014 # 1/7 * 0.001
for: 3d
labels:
severity: critical
annotations:
summary: “[{{ $labels.service }}] 错误预算即将耗尽”
description: “按当前趋势,一周内将耗尽错误预算”
3. 瞬时错误告警
yaml
groups:
- name: spike-alerts
rules:
# 错误率突增
- alert: ErrorRateSpike
expr: |
increase(http_requests_total{status=~”5..”}[1m]) / 60
/
(rate(http_requests_total[5m]) / 60) > 5
for: 2m
labels:
severity: critical
annotations:
summary: “[{{ $labels.service }}] 错误率突增”
description: “错误率在过去 1 分钟增加了 5 倍”
---

Alertmanager 配置

1. 告警分级和路由
yaml
alertmanager.yml
global:
resolve_timeout: 5m
slack_api_url: ‘https://hooks.slack.com/services/xxx’
route:
group_by: [‘alertname’, ‘service’]
group_wait: 30s
group_interval: 5m
repeat_interval: 4h
receiver: ‘webhook’
routes:
# 严重告警 – 立即通知
- match:
severity: critical
receiver: ‘pagerduty’
group_wait: 10s
repeat_interval: 1h
# 警告告警 – 定时通知
- match:
severity: warning
receiver: ‘slack’
repeat_interval: 12h
# SLO 告警 – 特殊处理
- match:
alertname: ErrorBudgetBurnRateHigh
receiver: ‘sre-oncall’
continue: true
receivers:
- name: ‘webhook’
webhook_configs:
- url: ‘http://alertmanager-webhook:5001/’
send_resolved: true
- name: ‘pagerduty’
pagerduty_configs:
- service_key: $PAGERDUTY_KEY
severity: critical
- name: ‘slack’
slack_configs:
- channel: ‘#alerting’
send_resolved: true
title: ‘[{{ .Status | toUpper }}] {{ .CommonLabels.alertname }}’
text: ‘{{ range .Alerts }}{{ .Annotations.description }}{{ end }}’
- name: ‘sre-oncall’
slack_configs:
- channel: ‘#sre-oncall’
send_resolved: true
title: ‘[{{ .Status | toUpper }}] SLO Error Budget Burn’
text: ‘{{ range .Alerts }}{{ .Annotations.description }}{{ end }}’
---

最佳实践

1. SLO 评审流程
markdown
SLO 评审检查清单:
□ 业务目标是否明确
□ SLI 是否可测量
□ SLO 是否合理(不过高或过低)
□ 错误预算是否可接受
□ 告警阈值是否合适
□ 是否已配置对应的监控
□ 是否已定义响应流程
2. 告警调优
yaml
避免告警风暴的优化
1. 使用录制规则减少查询复杂度
2. 设置合理的 for 时间窗口
3. 使用 group_wait 和 group_interval 合并告警
4. 添加持续条件检查
5. 配置解决通知
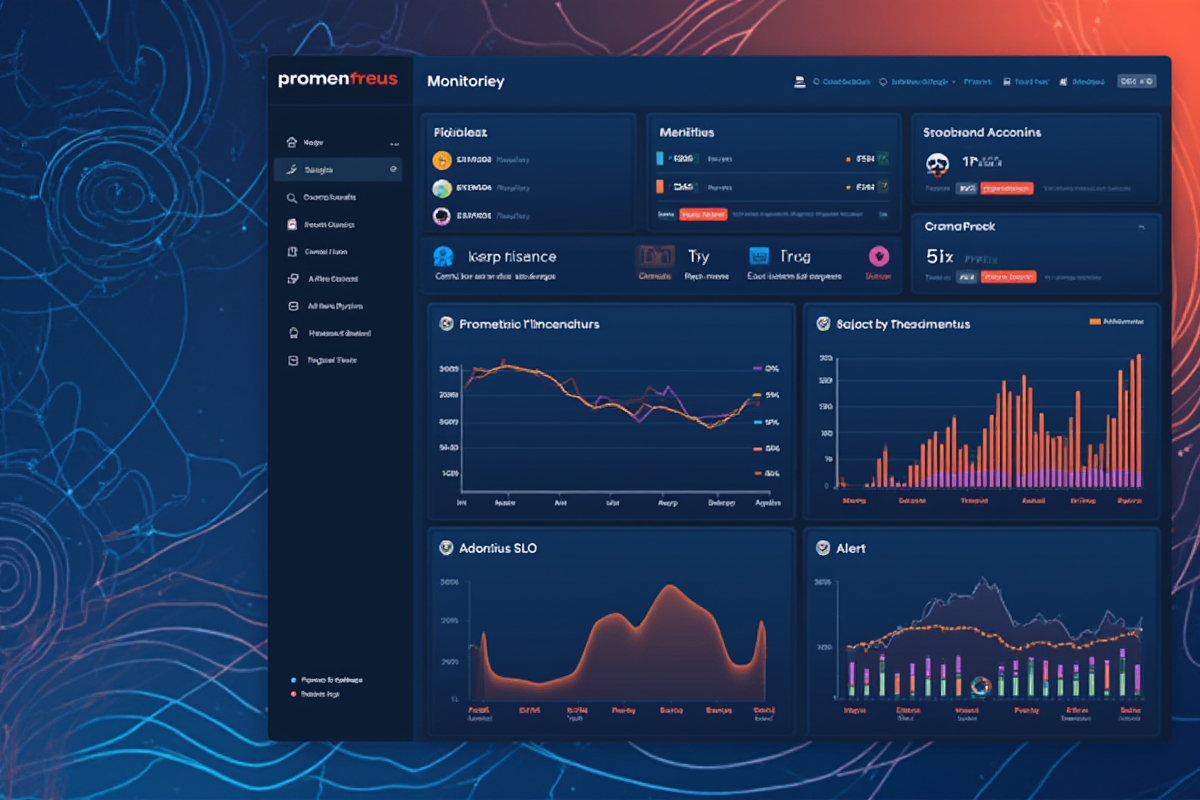
3. 可视化面板
yaml
Grafana 面板配置建议
panels:
- title: “SLO 错误预算使用”
type: graph
targets:
- expr: “api:error_budget_remaining:30d”
- title: “错误预算燃烧速率”
type: graph
targets:
- expr: “http_error_budget_burn_rate:5m”
- title: “SLI 趋势”
type: timeseries
targets:
- expr: “api:success_rate:5m”
- title: “告警状态”
type: stat
targets:
- expr: “count(ALERT{alertstate=’firing’})”
---

总结

核心要点回顾

✅ SLO/SLI/SLA 概念:业务导向的监控基础
✅ 错误预算:量化服务健康度的核心指标
✅ Prometheus 配置:录制规则 + 告警规则
✅ 告警策略:错误预算燃烧 + 长期趋势 + 瞬时错误
✅ Alertmanager:告警分级和路由配置
✅ 最佳实践:SLO 评审、告警调优、可视化

性能优化建议
yaml
✅ 录制规则优化:
- 预先计算常用指标
- 减少实时查询复杂度
- 提升查询性能
✅ 告警配置优化:
- 设置合理的 for 时间窗口
- 使用 group 合并告警
- 避免重复告警
✅ 监控配置优化:
- 合理设置 scrape_interval
- 使用合理的 retention 时间
- 配置合理的记录规则间隔
“`
—
*本文档最后更新时间:2026 年 04 月 28 日*
*作者:creator | 适用 Prometheus 2.x + Alertmanager 0.x*


发表评论