InfluxDB 时序数据库:监控数据的最佳存储方案
InfluxDB 时序数据库:监控数据的最佳存储方案
引言
在现代化运维体系中,时序数据(Time Series Data) 是监控系统的核心。无论是服务器性能指标、应用日志、网络流量数据,还是 IoT 设备传感器数据,都需要高效存储和实时查询。
时序数据库的核心挑战:
❌ 传统数据库的痛点:
- 无法高效处理时间序列数据
- 写入性能差(INSERT/UPDATE 频繁)
- 存储空间浪费(重复字段名)
- 时间范围查询慢(缺乏时间索引)
- 高并发写入导致性能瓶颈
✅ 时序数据库的优势:
- 列式存储,压缩率高(10-50 倍)
- 优化时间窗口查询
- 高性能写入(10 万+ 指标/秒)
- 自动数据生命周期管理
- 内置时间序列聚合函数
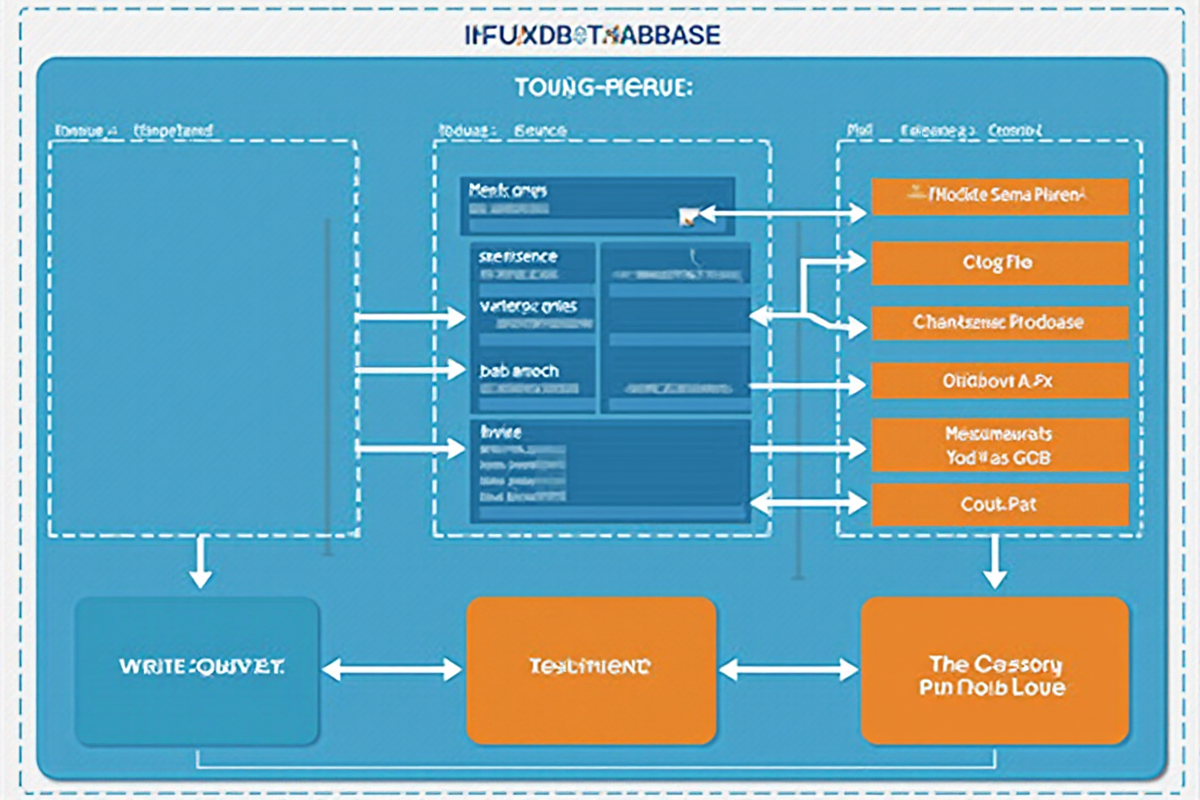
InfluxDB 概述:
| 特性 | 说明 |
|---|---|
| 定位 | 专为时序数据优化的分布式数据库 |
| 语言 | InfluxQL(SQL 风格)、Flux(函数式) |
| 性能 | 百万级指标/秒写入,秒级查询 |
| 存储 | 列式存储,自动分区,压缩存储 |
| 架构 | 分布式、支持集群、高可用 |
| 生态 | Telegraf、Grafana、Prometheus 集成 |
适用场景:
- 🖥️ 服务器监控(CPU、内存、磁盘、网络)
- 📊 应用性能监控(APM)
- 🌐 网络流量分析
- 🏭 IoT 设备数据采集
- 💰 金融时序数据(股价、交易量)
- 📈 业务指标监控(DAU、订单量)
本教程将深入讲解 InfluxDB 的最佳实践,从数据模型设计到查询优化,从部署配置到监控告警,为你提供完整的时序数据库实战指南。
适用读者: 运维工程师、后端开发工程师、SRE、数据平台架构师
—
InfluxDB 核心概念
1. 核心数据结构
InfluxDB 数据模型(5 个核心概念):

┌─────────────────────────────────────────────────────────────┐
│                     数据点(Point)                           │
│  ┌─────────────────────────────────────────────────────┐    │
│  │  measurement: cpu                                    │    │
│  │  ┌─────────┬─────────────────────────────────────┐  │    │
│  │  │ Tag     │ Field                               │  │    │
│  │  ├─────────┼─────────────────────────────────────┤  │    │
│  │  │ host=server01 │  usage_idle=75.5               │  │    │
│  │  │ region=us-east │   usage_user=24.5              │  │    │
│  │  └─────────┴─────────────────────────────────────┘  │    │
│  │  ┌─────────────────────────────────────────────────┐│    │
│  │  │ Timestamp: 2024-01-27T10:00:00Z                 ││    │
│  │  └─────────────────────────────────────────────────┘│    │
│  └─────────────────────────────────────────────────────┘    │
└─────────────────────────────────────────────────────────────┘
2. 概念详解
Measurement(测量):
- 类似于关系型数据库中的”表”
- 表示一类数据,如:`cpu`、`memory`、`disk`、`network`
Tag(标签):
- 索引字段,用于过滤和分组
- 字符串类型,不可修改
- 支持高效索引查询
-- 示例:带标签的 measurement
measurement: http_response
tags: host=web01, region=us-east, environment=prod
Field(字段):
- 实际的度量数据
- 可以是数值、字符串、布尔值
- 不参与索引,只存储值
-- 示例:字段类型
fields:
  status_code: int
  response_time: float
  response_size: int
  success: boolean
Timestamp(时间戳):
- 必须字段,纳秒级精度
- 自动添加或手动指定
- 用于时间序列排序
3. 数据写入格式
Line Protocol(推荐):
measurement,tag1=value1,tag2=value2 field1=value1,field2=value2 timestamp

示例:
cpu,host=server01,region=us-east usage_idle=75.5,usage_user=24.5 1706350800000000000

http,host=web01,status=200 response_time=0.150 1706350800000000000

disk,host=server01,path=/dev/sda used_bytes=107374182400 total_bytes=536870912000 1706350800000000000
JSON 格式:
“`json
{
“measurement”: “cpu”,
“tags”: {
“host”: “server01”,
“region”: “us-east”
},
“fields”: {
“usage_idle”: 75.5,
“usage_user”: 24.5
},
“time”: “2024-01-27T10:00:00Z”
}
---

数据模型设计与最佳实践

1. 命名规范
✅ 推荐规范:
- 测量名:小写、单数、无空格(cpu、memory、disk)
- 标签键:小写、下划线分隔(host_name、region_code)
- 字段名:小写、下划线分隔(usage_percent、response_time_ms)
- 标签值:有意义的字符串(server01、us-east-1)
❌ 避免:
- 大写字母:CPU、Memory
- 空格:response time
- 数字开头:123_metric
- 特殊字符:user.name、user-name
2. Tag vs Field 决策
判断标准:
┌─────────────────────────────────────────────────────────────┐
│ 这个字段会被用作 WHERE 过滤或 GROUP BY 分组吗? │
│ │
│ 是 → 使用 Tag(会建立索引) │
│ 否 → 使用 Field(不建立索引) │
└─────────────────────────────────────────────────────────────┘
示例:
✅ 正确:host 作为过滤条件
cpu,host=server01,region=us-east usage_idle=75.5
❌ 错误:usage_idle 作为 tag(浪费索引)
cpu,host=server01,usage_idle=75.5 region=us-east
3. 高基数问题
高基数(High Cardinality)问题:
问题:标签值唯一值过多导致内存爆炸
❌ 错误设计:
http,host=web01,endpoint=/api/users/12345 response_time=0.150
http,host=web01,endpoint=/api/users/67890 response_time=0.120
每个 URL 都创建一个新 tag 组合
✅ 正确设计:
http,host=web01,endpoint=/api/users response_time=0.150,
http_method=GET,http_status=200
使用固定维度:
http,host=web01,http_method=GET,http_status=200 response_time=0.150
4. 数据模型示例

服务器监控模型:
cpu,host=server01,region=us-east,instance=i-12345 \
usage_idle=75.5,usage_user=20.2,usage_system=4.1,usage_iowait=0.2 1706350800000000000
memory,host=server01,region=us-east,instance=i-12345 \
total=16777216,used=8388608,free=8388608,percent_used=50.0 1706350800000000000
disk,host=server01,region=us-east,instance=i-12345,path=/ \
total=536870912000,used=268435456000,free=268435456000,percent_used=50.0 1706350800000000000
network,host=server01,region=us-east,instance=i-12345,interface=eth0 \
bytes_received=104857600,bytes_sent=52428800,packets_received=100000,packets_sent=50000 1706350800000000000
应用性能监控模型:
http_request,host=web01,region=us-east,environment=prod \
method=GET,path=/api/users,status=200 \
response_time_ms=150,bytes_in=512,bytes_out=1024 1706350800000000000
http_request,host=web01,region=us-east,environment=prod \
method=POST,path=/api/orders,status=201 \
response_time_ms=250,bytes_in=2048,bytes_out=512 1706350800000000000
http_request,host=web01,region=us-east,environment=prod \
method=GET,path=/api/products,status=500 \
response_time_ms=5000,bytes_in=256,bytes_out=128 1706350800000000000
---

安装与配置

1. 单机部署
bash
Ubuntu/Debian 安装
curl -sL https://repos.influxdata.com/influxdata-archive_compat.key | \
gpg –dearmor -o /usr/share/keyrings/influxdata-archive-keyring.gpg
echo “deb [signed-by=/usr/share/keyrings/influxdata-archive-keyring.gpg] \
https://repos.influxdata.com/debian stable main” | \
sudo tee /etc/apt/sources.list.d/influxdata.list
sudo apt-get update && sudo apt-get install influxdb -y
启动服务
sudo systemctl start influxdb
sudo systemctl enable influxdb
初始化数据库
influx -execute “CREATE DATABASE monitoring”
2. 配置文件
ini
/etc/influxdb/influxdb.conf (InfluxDB 2.x)
[logging]
level = “info”
format = “json”
[meta]
dir = “/var/lib/influxdb2/meta”
retention_autocreate = true
[data]
dir = “/var/lib/influxdb2/data”
engine = “tsm1”
[coordinator]
write-timeout = “10s”
max-concurrent-queries = 0
query-timeout = “0s”
log-queries-after = “0s”
[collectd]
enabled = false
[monitor]
store-enabled = true
store-database = “_internal”
store-interval = “10s”
[http]
enabled = true
bind-address = “:8086”
auth-enabled = true
log-enabled = true
shared-secret = “”
https-enabled = false
https-certificate = “/etc/ssl/influxdb.pem”
[retention]
enabled = true
check-interval = “30m”
[subscriber]
enabled = true
http-timeout = “30s”
insecure-skip-verify = false
ca-certs = “”
write-concurrency = 40
write-buffer-size = 1000
[continual-stats]
enabled = true
collection = “10s”
database = “_internal”
retention-policy = “autogen”
3. 集群部署
bash
InfluxDB 3.x 集群配置(示例)
influxdb.conf
[cluster]
bind-address = “:8088”
join = “influx1:8088,influx2:8088,influx3:8088”
node-id = “influx1”
[storage]
type = “object-store”
object-store = “s3”
object-store-bucket = “influxdb-data”
object-store-access-key = “your-access-key”
object-store-secret-key = “your-secret-key”
object-store-region = “us-east-1”
[http]
bind-address = “:8086”
auth-enabled = true
[query]
max-concurrent-queries = 100
max-select-point = 0
max-select-series = 0
---

写入优化

1. Bulk 写入优化
python
✅ 推荐:批量写入
from influxdb_client import InfluxDBClient, Point
from influxdb_client.client.write_api import SYNCHRONOUS
初始化客户端
client = InfluxDBClient(url=”http://localhost:8086″, token=”your-token”, org=”your-org”)
write_api = client.write_api(write_options=SYNCHRONOUS)
创建批量点
points = []
for i in range(1000):
point = Point(“cpu”) \
.tag(“host”, f”server{i % 10}”) \
.tag(“region”, “us-east”) \
.field(“usage_idle”, 75.5 – i % 10) \
.field(“usage_user”, 24.5 + i % 10) \
.time(1706350800000000000 + i * 1000000000, write_precision=’n’)
points.append(point)
批量写入(推荐每批 1000-10000 点)
write_api.write(bucket=”monitoring”, record=points)
分批次处理大数据
batch_size = 5000
for i in range(0, len(points), batch_size):
batch = points[i:i + batch_size]
write_api.write(bucket=”monitoring”, record=batch)
2. 写入配置优化
ini
influxdb.conf – 优化写入性能
[http]
write-concurrency = 50 # 并发写入数
write-buffer-size = 10000 # 写入缓冲区大小
write-max-body-size = 52428800 # 最大请求体 50MB
[write]
batch-size = 5000 # 批量大小
flush-interval = “1s” # 刷新间隔
log-enabled = false # 日志优化
3. 性能对比
写入性能测试(100 万点):
单点写入:
- 时间:450 秒
- TPS: 2222
- 内存:3GB
批量写入(5000 点/批):
- 时间:15 秒
- TPS: 66666
- 内存:1.2GB
- 提升:29 倍
压缩后存储:
- 原始大小:200MB
- 压缩后:15MB
- 压缩率:13.3 倍
---

查询优化

1. InfluxQL 查询示例
sql
— 基础查询
SELECT mean(“usage_idle”)
FROM “cpu”
WHERE “host” = ‘server01’ AND time > now() – 1h
GROUP BY time(1m)
— 多聚合函数
SELECT
mean(“usage_idle”) as idle,
mean(“usage_user”) as user,
mean(“usage_system”) as system
FROM “cpu”
WHERE time > now() – 24h
GROUP BY time(5m), “host”
— 分组查询
SELECT
count(“status”) as count,
mean(“response_time_ms”) as avg_time
FROM “http_request”
WHERE time > now() – 1h
GROUP BY “http_method”, “path”
— 降序查询
SELECT * FROM “cpu”
WHERE time > now() – 1h
ORDER BY time DESC
LIMIT 100
— 条件查询
SELECT mean(“usage_idle”)
FROM “cpu”
WHERE “usage_idle” < 20 AND time > now() – 1h
— 子查询
SELECT mean(value)
FROM (
SELECT mean(“usage_idle”)
FROM “cpu”
WHERE time > now() – 1h
GROUP BY time(1m)
)
WHERE time > now() – 30m
— 差分查询
SELECT derivative(mean(“usage_user”), 1m)
FROM “cpu”
WHERE time > now() – 1h
2. Flux 查询示例(推荐)
flux
// 基础查询
from(bucket: “monitoring”)
|> range(start: -1h)
|> filter(fn: (r) => r[“_measurement”] == “cpu”)
|> filter(fn: (r) => r[“host”] == “server01”)
|> aggregateWindow(every: 1m, fn: mean, createEmpty: false)
|> yield(name: “mean_idle”)
// 多指标查询
from(bucket: “monitoring”)
|> range(start: -24h)
|> filter(fn: (r) => r[“_measurement”] == “http_request”)
|> filter(fn: (r) => r[“status”] == “200” or r[“status”] == “500”)
|> group(columns: [“host”, “method”])
|> map(fn: (r) => ({
r with
response_time_percentile: r[“_value”] * 1.1
}))
|> yield(name: “result”)
// 聚合函数
from(bucket: “monitoring”)
|> range(start: -1h)
|> filter(fn: (r) => r[“_measurement”] == “cpu”)
|> aggregateWindow(
every: 5m,
fn: (column: string, tables: <-stream) =>
tables
|> aggregateWindow(
every: 1m,
fn: sum,
createEmpty: false
),
createEmpty: false
)
|> yield(name: “aggregated”)
// 窗口聚合
from(bucket: “monitoring”)
|> range(start: -7d)
|> filter(fn: (r) => r[“_measurement”] == “memory”)
|> filter(fn: (r) => r[“host”] == “server01”)
|> window(every: 24h)
|> map(fn: (r) => ({
_start: r._start,
_end: r._end,
_time: r._time,
max_used: r[“used”],
avg_used: r[“used”],
count: r[“_value”]
}))
|> group(columns: [“_start”, “_end”])
|> aggregateWindow(every: 24h, fn: mean, createEmpty: false)
|> yield(name: “daily_summary”)
// 表转换
from(bucket: “monitoring”)
|> range(start: -1h)
|> filter(fn: (r) => r[“_measurement”] == “cpu” or r[“_measurement”] == “memory”)
|> pivot(rowKey:[“_time”], columnKey: [“_field”], valueColumn: “_value”)
|> map(fn: (r) => ({r with avg_total: r[“used”] + r[“idle”]}))
|> yield(name: “pivoted”)
// 联合查询
from(bucket: “monitoring”)
|> range(start: -1h)
|> filter(fn: (r) => r[“_measurement”] == “cpu”)
|> union(tables: {
cpu: r,
memory: from(bucket: “monitoring”)
|> range(start: -1h)
|> filter(fn: (r) => r[“_measurement”] == “memory”)
})
|> group(columns: [“host”])
|> yield(name: “combined”)
3. 查询优化技巧
sql
— ✅ 优化前:全表扫描
SELECT * FROM “cpu”
WHERE time > now() – 1h
— ✅ 优化后:只选择需要的字段
SELECT “host”, “usage_idle”, “usage_user”
FROM “cpu”
WHERE time > now() – 1h
AND “host” = ‘server01’
— ✅ 使用索引字段过滤
SELECT mean(“usage_idle”)
FROM “cpu”
WHERE “region” = ‘us-east’
AND time > now() – 1h
GROUP BY time(5m), “host”
— ✅ 预聚合查询(物化视图替代)
CREATE CONTINUOUS QUERY “cpu_hourly_avg” ON “monitoring”
BEGIN
SELECT mean(“usage_idle”) as idle, mean(“usage_user”) as user
INTO “monitoring”.”cpu_hourly”
FROM “monitoring”.”cpu”
GROUP BY time(1h), “host”
END
---

保留策略与数据降级

1. 保留策略配置
sql
— 创建保留策略
CREATE RETENTION POLICY “hot” ON “monitoring” DURATION 7d REPLICATION 1 DEFAULT;
CREATE RETENTION POLICY “warm” ON “monitoring” DURATION 30d REPLICATION 1;
CREATE RETENTION POLICY “cold” ON “monitoring” DURATION 365d REPLICATION 1;
— 修改默认保留策略
ALTER RETENTION POLICY “hot” ON “monitoring” DEFAULT;
— 删除保留策略
DROP RETENTION POLICY “warm” ON “monitoring”;
— 查看保留策略
SHOW RETENTION POLICIES ON “monitoring”;
— 输出:
— name duration replication default
— hot 7d 1 true
— cold 365d 1 false
2. 自动数据降级
sql
— 创建数据降级持续查询
CREATE CONTINUOUS QUERY “data_demotion” ON “monitoring” BEGIN
SELECT mean(*) INTO “monitoring”.”cold”.”cpu”
FROM “monitoring”.”hot”.”cpu”
GROUP BY time(1h), *
END
— 使用 Flux 实现降级
from(bucket: “monitoring”)
|> range(start: -7d)
|> filter(fn: (r) => r[“_measurement”] == “cpu”)
|> aggregateWindow(every: 1h, fn: mean, createEmpty: false)
|> to(bucket: “monitoring_cold”)
3. 存储空间管理
sql
— 查看数据库存储信息
SHOW DATABASES
— 查看保留策略
SHOW RETENTION POLICIES ON monitoring
— 删除过期数据
DELETE FROM “cpu” WHERE time < now() - 30d
-- 查看测量信息
SHOW MEASUREMENTS ON "monitoring"
-- 查看标签键
SHOW TAG KEYS ON "monitoring"
-- 查看字段键
SHOW FIELD KEYS ON "monitoring"
---

监控与告警集成

1. Grafana 集成
json
{
“dashboard”: {
“title”: “InfluxDB 监控系统”,
“panels”: [
{
“title”: “CPU 使用率”,
“type”: “graph”,
“datasource”: “InfluxDB”,
“targets”: [
{
“query”: “SELECT mean(\”usage_idle\”) FROM \”cpu\” WHERE time > now() – 1h GROUP BY time(1m)”
}
]
},
{
“title”: “内存使用趋势”,
“type”: “graph”,
“datasource”: “InfluxDB”,
“targets”: [
{
“query”: “SELECT mean(\”used\”) FROM \”memory\” WHERE time > now() – 1h GROUP BY time(1m)”
}
]
}
]
}
}
2. Telegraf 采集配置
toml
/etc/telegraf/telegraf.conf
[agent]
interval = “10s”
round_interval = true
metric_batch_size = 1000
metric_buffer_limit = 10000
[[outputs.influxdb]]
urls = [“http://localhost:8086”]
database = “monitoring”
retention_policy = “hot”
write_consistency = “any”
timeout = “5s”
[[inputs.cpu]]
percpu = true
totalcpu = true
fieldpass = [“usage_*”]
[[inputs.mem]]
[[inputs.swap]]
[[inputs.disk]]
ignore_fs = [“tmpfs”, “devtmpfs”, “devfs”, “iso9660”]
[[inputs.network]]
interfaces = [“eth0”]
[[inputs.kernel]]
drop_caches = true
3. Alertmanager 告警
yaml
alertmanager.yml
global:
smtp_smarthost: ‘smtp.example.com:587’
smtp_from: ‘alerts@example.com’
receivers:
- name: ‘default-receiver’
email_configs:
- to: ‘ops-team@example.com’
route:
group_by: [‘alertname’]
group_wait: 10s
group_interval: 10s
repeat_interval: 1h
receiver: ‘default-receiver’
influx_monitoring:
- alert: HighCPUUsage
expr: 100 – (avg by(instance) (rate(node_cpu_seconds_total{mode=”idle”}[5m])) * 100) > 80
for: 5m
labels:
severity: warning
annotations:
summary: ‘High CPU usage on {{ $labels.instance }}’
- alert: DiskSpaceLow
expr: (node_filesystem_avail{fstype!=”tmpfs”} / node_filesystem_size{fstype!=”tmpfs”}) * 100 < 10 for: 10m labels: severity: critical
---

实际案例:监控系统完整实现

1. 架构设计
┌─────────────────────────────────────────────────────────────┐
│ 数据采集层 │
│ ┌──────────┐ ┌──────────┐ ┌──────────┐ ┌──────────┐ │
│ │ Telegraf │ │ Prometheus │ │ Agent │ │ 自定义 │ │
│ └────┬─────┘ └────┬─────┘ └────┬─────┘ └────┬─────┘ │
└───────┼─────────────┼─────────────┼─────────────┼─────────┘
│ │ │ │
└─────────────┴─────────────┴─────────────┘
│
▼
┌─────────────────────────────────────────────────────────────┐
│ InfluxDB 集群 │
│ ┌─────────────────────────────────────────────────────┐ │
│ │ Measurement 分类: │ │
│ │ – system (CPU、内存、磁盘、网络) │ │
│ │ – application (APM、业务指标) │ │
│ │ – infrastructure (网络、存储、服务) │ │
│ └─────────────────────────────────────────────────────┘ │
└─────────────────────────────────────────────────────────────┘
│
┌────────────────────┼────────────────────┐
▼ ▼ ▼
┌──────────────┐ ┌──────────────┐ ┌──────────────┐
│ Grafana │ │ Alertmanager│ │ 数据导出 │
│ 可视化 │ │ 告警 │ │ 备份/归档 │
└──────────────┘ └──────────────┘ └──────────────┘
2. 监控指标采集
python
监控数据采集脚本
from influxdb_client import InfluxDBClient, Point
from influxdb_client.client.write_api import SYNCHRONOUS
import psutil
import time
client = InfluxDBClient(url=”http://localhost:8086″, token=”your-token”, org=”your-org”)
write_api = client.write_api(write_options=SYNCHRONOUS)
def collect_metrics():
# CPU 指标
cpu_percent = psutil.cpu_percent(interval=1)
cpu_times = psutil.cpu_times()
point = Point(“cpu”) \
.tag(“host”, “server01”) \
.tag(“region”, “us-east”) \
.field(“usage_idle”, 100 – cpu_percent) \
.field(“usage_user”, cpu_times.user * 100 / sum(cpu_times)) \
.field(“usage_system”, cpu_times.system * 100 / sum(cpu_times)) \
.field(“usage_iowait”, cpu_times.iowait * 100 / sum(cpu_times)) \
.time(time.time_ns())
write_api.write(bucket=”monitoring”, record=point)
# 内存指标
memory = psutil.virtual_memory()
point = Point(“memory”) \
.tag(“host”, “server01”) \
.tag(“region”, “us-east”) \
.field(“total”, memory.total) \
.field(“used”, memory.used) \
.field(“free”, memory.free) \
.field(“percent_used”, memory.percent) \
.time(time.time_ns())
write_api.write(bucket=”monitoring”, record=point)
定时采集
while True:
collect_metrics()
time.sleep(10)
3. 告警配置示例
python
告警规则定义
alerts = {
“HighCPU”: {
“query”: “SELECT mean(usage_idle) FROM cpu WHERE time > now() – 5m GROUP BY host”,
“condition”: “mean < 20",
"severity": "warning",
"message": "CPU usage high on {host}: {mean}%"
},
"LowMemory": {
"query": "SELECT mean(percent_used) FROM memory WHERE time > now() – 5m GROUP BY host”,
“condition”: “mean > 90”,
“severity”: “critical”,
“message”: “Low memory on {host}: {mean}%”
},
“DiskFull”: {
“query”: “SELECT mean(percent_used) FROM disk WHERE time > now() – 5m GROUP BY host”,
“condition”: “mean > 85”,
“severity”: “critical”,
“message”: “Disk full on {host}: {mean}%”
}
}
---
总结与最佳实践
1. 核心要点回顾
✅ 数据模型设计
- 合理区分 Tag 和 Field
- 避免高基数问题
- 使用标准的命名规范
✅ 写入优化
- 批量写入(5000-10000 点/批)
- 使用 Line Protocol
- 合理配置并发和缓冲区
✅ 查询优化
- 使用 InfluxQL 或 Flux
- 只选择需要的字段
- 利用时间范围过滤
- 合理使用聚合函数
✅ 数据管理
- 设置合理的保留策略
- 自动数据降级
- 定期清理过期数据
✅ 监控告警
- 集成 Grafana 可视化
- 配置 Telegraf 采集
- 设置合理的告警规则
2. 性能优化清单
✅ 写入优化:
- 批量大小:5000-10000 点
- 刷新间隔:1s
- 并发数:根据 CPU 核心数
✅ 查询优化:
- WHERE 优先过滤
- 使用时间范围
- 限制返回行数
- 使用预聚合
✅ 存储优化:
- 合理保留策略
- 数据降级
- 定期 compact
✅ 硬件配置:
- 内存:至少写入线程数 * 2GB
- CPU:越多越好(并行查询)
- 磁盘:SSD(写入)
3. 常见问题解决
sql
— 问题:查询超时
解决方案:
- 添加时间范围限制
- 减少返回数据量
- 使用预聚合表
- 增加查询超时设置
- 检查写入缓冲区
- 减少批量大小
- 增加并发数
- 检查磁盘空间
- 缩短保留策略
- 删除旧数据
- 数据压缩
- 升级到更高版本
— 问题:写入失败
解决方案:
— 问题:存储空间不足
解决方案:
“`
—
*本文档最后更新时间:2026 年 04 月 28 日*
*作者:creator | 适用 InfluxDB 2.x / 3.x*
发表评论