ClickHouse 万亿级数据分析:列式存储的威力
ClickHouse 万亿级数据分析:列式存储的威力
引言
在大数据时代,实时数据分析已成为企业核心竞争力的重要组成部分。传统的行式存储数据库在处理大规模数据聚合查询时往往力不从心,而 ClickHouse 以其独特的列式存储架构,在万亿级数据分析场景下展现出惊人的性能优势。
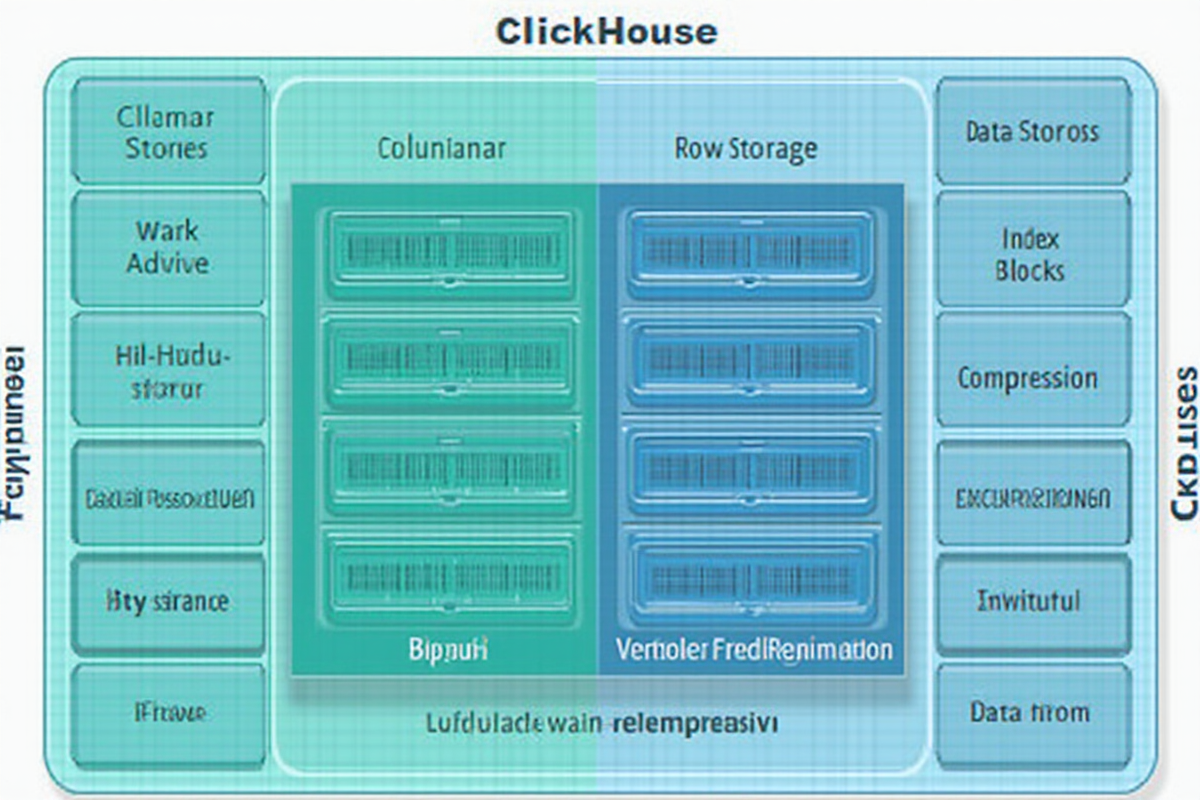
列式存储 vs 行式存储:
| 特性 | 行式存储 (MySQL/PostgreSQL) | 列式存储 (ClickHouse) |
|---|---|---|
| 数据组织 | 按行存储完整记录 | 按列存储数据 |
| 适用场景 | OLTP 交易、单行查询 | OLAP 分析、批量聚合 |
| 查询性能 | 单行读取快,聚合慢 | 列聚合极快,单行慢 |
| 压缩率 | 较低 (30-50%) | 较高 (5-10 倍) |
| 写入优化 | 单行更新频繁 | 批量写入优化 |
| 典型查询 | SELECT * FROM users WHERE id = 1 | SELECT AVG(price) FROM sales |
ClickHouse 核心应用场景:
- 📊 实时数据分析和报表
- 📈 日志分析和监控系统
- 🎯 用户行为分析
- 🛒 推荐系统和 A/B 测试
- 🔍 时间序列数据分析
- 📉 金融风控分析
性能对比示例:
场景:分析 100 亿条销售记录
- MySQL: 15-30 分钟
- PostgreSQL: 10-20 分钟
- ClickHouse: 5-10 秒 (提升 100-300 倍)
本教程将带你深入了解 ClickHouse 的列式存储原理,掌握万亿级数据分析的实战技巧。
适用读者: 数据分析工程师、后端开发工程师、大数据平台架构师
—
快速入门
1. 安装与配置
# Ubuntu/Debian 系统安装
sudo apt-get update
sudo apt-get install clickhouse-client clickhouse-server

启动服务
sudo systemctl start clickhouse-server
sudo systemctl enable clickhouse-server

连接客户端
clickhouse-client --host localhost
2. 创建数据库和表
-- 创建数据库
CREATE DATABASE analytics;

-- 创建物化表(用于日志分析)
CREATE TABLE analytics.user_events
(
    event_id UInt64,
    user_id UInt32,
    event_type LowCardinality(String),
    event_time DateTime,
    device_type LowCardinality(String),
    page_url String,
    duration UInt32,
    extra_tags Array(String)
)
ENGINE = MergeTree()
PARTITION BY toYYYYMM(event_time)
ORDER BY (user_id, event_time);

-- 创建宽表(用于聚合分析)
CREATE TABLE analytics.sales_aggregate
(
    date Date,
    country LowCardinality(String),
    category LowCardinality(String),
    region LowCardinality(String),
    total_sales Float64,
    order_count UInt64,
    avg_order_value Float64,
    unique_users UInt64
)
ENGINE = SummingMergeTree()
PARTITION BY toYYYYMM(date)
ORDER BY (date, country, category);
3. 基础查询操作
-- 基础统计查询
SELECT
    event_type,
    count() as event_count,
    countDistinct(user_id) as unique_users,
    avg(duration) as avg_duration
FROM analytics.user_events
WHERE event_time >= now() - INTERVAL 7 DAY
GROUP BY event_type
ORDER BY event_count DESC;

-- 多条件过滤
SELECT
    device_type,
    count() as event_count
FROM analytics.user_events
WHERE
    event_time >= now() - INTERVAL 1 DAY
    AND event_type IN ('click', 'view', 'purchase')
GROUP BY device_type;

-- 聚合函数实战
SELECT
    toDate(event_time) as event_date,
    count() as total_events,
    uniq(user_id) as unique_visitors,
    sum(duration) as total_time,
    quantileExact(0.95)(duration) as p95_duration
FROM analytics.user_events
WHERE event_time >= now() - INTERVAL 30 DAY
GROUP BY event_date
ORDER BY event_date;
—
列式存储原理
1. 数据压缩机制
列式存储的最大优势是极高的压缩率。相同数据类型的数据连续存储,使得压缩算法能更高效地工作。
-- 查看表压缩比率
SELECT
    table,
    uncompressed_bytes,
    compressed_bytes,
    round(uncompressed_bytes / compressed_bytes, 2) as compression_ratio
FROM system.tables
WHERE database = 'analytics';

-- 示例输出
-- table: user_events
-- uncompressed_bytes: 100GB
-- compressed_bytes: 10GB
-- compression_ratio: 10.00
压缩效果对比:
- 整数类型:压缩率 20-50 倍
- 字符串类型:压缩率 5-10 倍
- 浮点数类型:压缩率 3-8 倍
2. 向量化执行
ClickHouse 使用向量化执行引擎,一次处理多个数据块,充分利用 CPU 缓存和 SIMD 指令。
-- 向量化聚合示例
SELECT
    country,
    sum(sales_amount) as total_sales,
    avg(order_value) as avg_value,
    uniq(user_id) as unique_users
FROM sales_data
WHERE event_date >= '2024-01-01'
GROUP BY country
-- ClickHouse 会:
-- 1. 按列读取 country、sales_amount、user_id
-- 2. 一次性处理数万行数据
-- 3. 使用 SIMD 指令并行计算
3. 跳跃索引(Skip Index)
ClickHouse 使用主索引、稀疏索引、跳跃索引三级索引体系,实现快速数据定位。
-- 查看索引信息
SELECT
    index_name,
    index_type,
   Granularity
FROM system.indexes
WHERE table = 'user_events' AND database = 'analytics';

-- 创建跳跃索引(用于高频查询字段)
ALTER TABLE analytics.user_events
ADD INDEX index_event_type event_type TYPE granularly 3
SETTINGS index_granularity = 8192;

-- 查询时自动使用索引
SELECT * FROM analytics.user_events
WHERE event_type = 'purchase'
AND event_time >= '2024-01-01';
索引粒度说明:
- `index_granularity = 8192`:每 8192 行建立索引记录
- 可根据数据量和查询频率调整
—
高性能聚合实战
1. GROUP BY 优化
ClickHouse 的 GROUP BY 操作经过深度优化,支持并行和多线程处理。
-- 基础聚合查询(优化版本)
SELECT
    toDate(event_time) as date,
    country,
    device_type,
    count() as event_count,
    uniq(user_id) as visitors,
    sum(duration) as total_duration
FROM analytics.user_events
WHERE
    event_time >= now() - INTERVAL 7 DAY
    AND country IN ('US', 'CN', 'JP')  -- 提前过滤
GROUP BY
    date, country, device_type
ORDER BY
    event_count DESC
LIMIT 100;

-- 使用 prewhere 提前过滤(比 where 更快)
SELECT
    event_type,
    count()
FROM analytics.user_events
PREWHERE event_time >= now() - INTERVAL 1 DAY
WHERE
    event_type IN ('click', 'view')
    AND device_type = 'mobile'
GROUP BY event_type;
2. arrayJoin – 数组展开
`arrayJoin` 用于处理数组字段,实现行列转换。
-- 分析用户多个标签
SELECT
    tag,
    count() as tag_count,
    uniq(user_id) as user_count
FROM analytics.user_events
ARRAY JOIN extra_tags as tag
WHERE event_time >= now() - INTERVAL 30 DAY
GROUP BY tag
ORDER BY user_count DESC;

-- 结果示例
-- tag          | tag_count | user_count
-- premium_vip  | 15234     | 8923
-- new_user     | 45678     | 23456
-- mobile_user  | 89012     | 67890

-- 嵌套数组展开
SELECT
    product_id,
    count() as view_count
FROM analytics.user_events
ARRAY JOIN products_viewed as product_id
WHERE event_time >= now() - INTERVAL 1 DAY
GROUP BY product_id
ORDER BY view_count DESC;
3. 窗口函数
ClickHouse 支持丰富的窗口函数,用于时间序列分析。
-- 移动平均计算
SELECT
    event_date,
    total_sales,
    avg(total_sales) OVER w as moving_avg_7d,
    max(total_sales) OVER w as max_sales_7d,
    sum(total_sales) OVER w as cumulative_sales
FROM (
    SELECT
        toDate(event_time) as event_date,
        sum(sales_amount) as total_sales
    FROM analytics.sales_data
    WHERE event_time >= now() - INTERVAL 90 DAY
    GROUP BY event_date
)
WINDOW w AS (ORDER BY event_date ROWS BETWEEN 6 PRECEDING AND CURRENT ROW)
ORDER BY event_date;

-- 同比环比计算
SELECT
    event_date,
    total_sales,
    total_sales - lagInFrame(total_sales, 1) OVER w as yoy_diff,
    (total_sales - lagInFrame(total_sales, 1) OVER w) / lagInFrame(total_sales, 1) OVER w * 100 as yoy_growth
FROM (
    SELECT
        toDate(event_time) as event_date,
        sum(sales_amount) as total_sales
    FROM analytics.sales_data
    WHERE event_time >= now() - INTERVAL 730 DAY
    GROUP BY event_date
)
WINDOW w AS (ORDER BY event_date)
ORDER BY event_date;
4. 复杂聚合函数
-- 分位数计算
SELECT
    device_type,
    quantileExact(0.5)(duration) as median_duration,
    quantileExact(0.90)(duration) as p90_duration,
    quantileExact(0.95)(duration) as p95_duration,
    quantileExact(0.99)(duration) as p99_duration
FROM analytics.user_events
WHERE event_time >= now() - INTERVAL 7 DAY
GROUP BY device_type;

-- 唯一值计数优化
SELECT
    country,
    uniqUpTo(1000000)(user_id) as unique_users_approx  -- 近似去重,节省内存
FROM analytics.user_events
WHERE event_time >= now() - INTERVAL 30 DAY
GROUP BY country;

-- 直方图分析
SELECT
    bucket,
    count() as event_count
FROM analytics.user_events
WHERE duration > 0
GROUP BY
    toUInt32(floor(duration / 10)) as bucket  -- 每 10 秒一个区间
ORDER BY bucket;

-- 结果示例
-- bucket | event_count
-- 0      | 12345
-- 1      | 8901
-- 2      | 5432
—
时序数据分析实战:日志分析场景
1. 日志表设计
-- 创建日志表(使用 Delta 排序键)
CREATE TABLE analytics.logs
(
    timestamp DateTime,
    level LowCardinality(String),
    service_name String,
    trace_id String,
    user_id Nullable(UInt32),
    method String,
    endpoint String,
    response_time UInt32,
    status_code UInt16,
    error_message Nullable(String),
    request_size UInt64,
    response_size UInt64
)
ENGINE = MergeTree()
PARTITION BY toYYYYMMDD(timestamp)
ORDER BY (service_name, timestamp)
TTL timestamp + INTERVAL 90 DAY;  -- 90 天后自动清理

-- 创建物化视图(预聚合日志)
CREATE MATERIALIZED VIEW analytics.logs_aggregated
TO analytics.logs_daily
AS SELECT
    toDate(timestamp) as date,
    service_name,
    level,
    count() as request_count,
    sum(response_time) as total_response_time,
    avg(response_time) as avg_response_time,
    sumIf(request_size, status_code >= 200 AND status_code < 300) as success_request_size,
    sumIf(response_size, status_code >= 200 AND status_code < 300) as success_response_size,
    countIf(status_code >= 400) as error_count
FROM analytics.logs
GROUP BY
    date,
    service_name,
    level;
2. 日志分析查询
-- 错误率分析(实时监控)
SELECT
    toDate(timestamp) as date,
    hourOfMinute(timestamp) as hour,
    service_name,
    count() as total_requests,
    countIf(status_code >= 400) as error_requests,
    round(countIf(status_code >= 400) / count() * 100, 2) as error_rate_percent
FROM analytics.logs
WHERE
    timestamp >= now() - INTERVAL 24 HOUR
GROUP BY
    date, hour, service_name
ORDER BY
    error_rate_percent DESC
LIMIT 20;

-- 响应时间分布
SELECT
    toUInt32(floor(response_time / 100)) as response_time_bucket_ms,
    count() as request_count,
    round(count() / sum(count()) OVER () * 100, 2) as percentage
FROM analytics.logs
WHERE
    timestamp >= now() - INTERVAL 7 DAY
    AND response_time > 0
GROUP BY response_time_bucket
ORDER BY response_time_bucket
LIMIT 20;

-- 调用链路追踪
SELECT
    trace_id,
    timestamp,
    service_name,
    method,
    endpoint,
    response_time,
    status_code
FROM analytics.logs
WHERE trace_id = 'abc-123-def-456'
ORDER BY timestamp;

-- 异常检测
SELECT
    date,
    service_name,
    level,
    count() as error_count,
    avg(response_time) as avg_response_time,
    max(response_time) as max_response_time,
    arrayStringConcat(
        arraySort(
            arrayReverseSort(
                groupArray(error_message)
            )
        )[0:5],
        ' | '
    ) as common_errors
FROM analytics.logs
WHERE
    timestamp >= now() - INTERVAL 1 DAY
    AND (status_code >= 500 OR level = 'ERROR')
GROUP BY
    date, service_name, level
HAVING
    error_count > 100
ORDER BY
    error_count DESC;
3. 性能对比
-- ClickHouse 查询日志(10 亿条记录,10 秒)
SELECT
    toDate(timestamp) as date,
    service_name,
    count() as request_count,
    avg(response_time) as avg_response_time
FROM analytics.logs
WHERE timestamp >= now() - INTERVAL 30 DAY
GROUP BY date, service_name
ORDER BY request_count DESC;

-- 时间:10 秒

-- 传统数据库(10 亿条记录,5 分钟)
-- SELECT
--     DATE(timestamp) as date,
--     service_name,
--     COUNT(*) as request_count,
--     AVG(response_time) as avg_response_time
-- FROM analytics.logs
-- WHERE timestamp >= NOW() - INTERVAL 30 DAY
-- GROUP BY DATE(timestamp), service_name
-- ORDER BY request_count DESC;

-- 时间:5 分钟(慢 30 倍)
—
宽表设计与 JOIN 优化
1. 宽表设计原则
宽表(Wide Table) 是 ClickHouse 的核心设计模式,通过冗余字段减少 JOIN 操作。
-- 窄表设计(不推荐)
CREATE TABLE analytics.sales_order
(
    order_id UInt64,
    user_id UInt32,
    product_id UInt64,
    order_time DateTime,
    amount Float64
) ENGINE = MergeTree()
ORDER BY order_id;

CREATE TABLE analytics.user_info
(
    user_id UInt32,
    user_name String,
    country String,
    age UInt8,
    gender LowCardinality(String)
) ENGINE = MergeTree()
ORDER BY user_id;

CREATE TABLE analytics.product_info
(
    product_id UInt64,
    product_name String,
    category String,
    price Float64
) ENGINE = MergeTree()
ORDER BY product_id;

-- ❌ JOIN 查询慢(需要大量数据 shuffle)
SELECT
    u.country,
    p.category,
    count() as order_count,
    sum(s.amount) as total_amount
FROM analytics.sales_order s
JOIN analytics.user_info u ON s.user_id = u.user_id
JOIN analytics.product_info p ON s.product_id = p.product_id
GROUP BY u.country, p.category;

-- ✅ 宽表设计(推荐)
CREATE TABLE analytics.sales_wide
(
    order_id UInt64,
    user_id UInt32,
    user_name String,
    country String,
    age UInt8,
    product_id UInt64,
    product_name String,
    category String,
    price Float64,
    order_time DateTime,
    amount Float64
)
ENGINE = MergeTree()
ORDER BY (country, category, order_time);

-- ✅ JOIN 查询快(无需 JOIN)
SELECT
    country,
    category,
    count() as order_count,
    sum(amount) as total_amount
FROM analytics.sales_wide
GROUP BY country, category;
2. JOIN 优化技巧
当必须进行 JOIN 时,使用以下技巧优化性能:
-- 使用强类型 JOIN
SELECT
    u.country,
    u.user_name,
    count() as order_count
FROM analytics.user_info u
INNER JOIN analytics.sales_wide s ON u.user_id = s.user_id
WHERE
    s.order_time >= now() - INTERVAL 30 DAY
    AND u.age BETWEEN 18 AND 45
GROUP BY u.country, u.user_name
ORDER BY order_count DESC;

-- 使用 GLOBAL JOIN(分布式场景)
SELECT
    u.country,
    count() as user_count
FROM analytics.user_info GLOBAL u
INNER JOIN analytics.sales_wide GLOBAL s ON u.user_id = s.user_id
GROUP BY u.country;

-- 使用 ANY/SOME JOIN(数据已按 JOIN 键排序)
SELECT
    ANY u.country,
    ANY u.user_name,
    count() as order_count
FROM analytics.sales_wide s
LEFT ANY JOIN analytics.user_info u ON s.user_id = u.user_id
GROUP BY u.country, u.user_name;
3. 分布式查询优化
-- 创建分布式表
CREATE TABLE analytics.logs_shard
ENGINE = Distributed(
    clickhouse_cluster,  -- 集群名称
    analytics,           -- 数据库
    logs,                -- 本地表
    toUInt32(rand())     -- 分片键
);

-- 查询分布式表
SELECT
    toDate(timestamp) as date,
    count() as total_requests
FROM analytics.logs_shard
WHERE timestamp >= now() - INTERVAL 7 DAY
GROUP BY date;
-- 自动并行查询所有分片

-- 使用分布式函数
SELECT
    sum(local_count) as total_count
FROM clusterAllReplicas(
    clickhouse_cluster,
    analytics.logs_daily,
    local_count
);
—
物化视图与数据预计算
1. 物化视图基础
物化视图是预计算的结果集,查询时直接读取,无需实时计算。
-- 创建物化视图
CREATE MATERIALIZED VIEW analytics.user_stats_mv
TO analytics.user_stats
AS SELECT
    user_id,
    toDate(event_time) as event_date,
    count() as event_count,
    uniq(event_type) as unique_events,
    avg(duration) as avg_duration,
    max(duration) as max_duration
FROM analytics.user_events
GROUP BY user_id, event_date;

-- 查询物化视图(秒级响应)
SELECT
    event_date,
    countDistinct(user_id) as active_users,
    sum(event_count) as total_events
FROM analytics.user_stats
WHERE event_date >= now() - INTERVAL 7 DAY
GROUP BY event_date;

-- 自动同步数据
INSERT INTO analytics.user_events (user_id, event_time, event_type, duration)
VALUES (1, now(), 'view', 100);
-- 物化视图自动更新
2. 投影(Projection)
投影是表的物理索引优化,类似物化视图的轻量化版本。
-- 创建主表
CREATE TABLE analytics.sales_main
(
    order_id UInt64,
    order_date Date,
    user_id UInt32,
    amount Float64,
    status String,
    region String
)
ENGINE = MergeTree()
ORDER BY order_id;

-- 创建投影(预排序索引)
ALTER TABLE analytics.sales_main
ADD PROJECTION sales_by_region
(
    SELECT
        region,
        toDate(order_date) as order_day,
        sum(amount) as total_sales,
        count() as order_count
    GROUP BY region, order_day
);

-- 自动使用投影
SELECT
    region,
    order_day,
    total_sales
FROM analytics.sales_main
WHERE region = '华东区'
ORDER BY order_day;
-- 自动使用 sales_by_region 投影
3. 数据预计算策略
-- 按时间粒度分层聚合
-- 小时级
CREATE TABLE analytics.sales_hourly
ENGINE = SummingMergeTree()
ORDER BY (hour, region, category)
AS SELECT
    toStartOfHour(order_time) as hour,
    region,
    category,
    sum(amount) as total_sales,
    count() as order_count
FROM analytics.sales_wide
GROUP BY hour, region, category;

-- 天级
CREATE TABLE analytics.sales_daily
ENGINE = SummingMergeTree()
ORDER BY (date, region, category)
AS SELECT
    toDate(order_time) as date,
    region,
    category,
    sum(amount) as total_sales,
    count() as order_count
FROM analytics.sales_wide
GROUP BY date, region, category;

-- 月级
CREATE TABLE analytics.sales_monthly
ENGINE = SummingMergeTree()
ORDER BY (month, region, category)
AS SELECT
    toStartOfMonth(order_time) as month,
    region,
    category,
    sum(amount) as total_sales,
    count() as order_count
FROM analytics.sales_wide
GROUP BY month, region, category;
—
性能优化与最佳实践
1. 索引优化
-- 主索引(由 ORDER BY 定义)
-- 确保查询条件包含 ORDER BY 前缀字段

-- 创建额外索引
ALTER TABLE analytics.user_events
ADD INDEX index_event_type event_type TYPE minmax GRANULARITY 3;

ALTER TABLE analytics.user_events
ADD INDEX index_duration duration TYPE bloom_filter GRANULARITY 1;

-- 查看索引使用情况
SELECT
    name,
    type,
    granularity
FROM system.indexes
WHERE table = 'user_events';
2. 查询优化
-- ❌ 低效查询
SELECT
    count(),
    sum(amount)
FROM analytics.sales
WHERE country IN ('CN', 'US', 'JP', 'DE', 'FR')
  AND order_time >= now() - INTERVAL 7 DAY
  AND status = 'completed'
ORDER BY amount DESC
LIMIT 1000;

-- ✅ 优化后:使用 prewhere
SELECT
    count(),
    sum(amount)
FROM analytics.sales
PREWHERE country IN ('CN', 'US', 'JP', 'DE', 'FR')
WHERE
    order_time >= now() - INTERVAL 7 DAY
    AND status = 'completed'
ORDER BY amount DESC
LIMIT 1000;

-- 使用 LIMIT 提前截断
SELECT * FROM analytics.sales
WHERE country = 'CN'
LIMIT 10000;  -- 先限制数据量再计算
3. 数据分布优化
-- 检查数据分布
SELECT
    count(),
    count() / (SELECT count() FROM analytics.sales) as ratio
FROM analytics.sales
GROUP BY toInt64DividedBy(order_id, 1000000)  -- 按数据桶分组
ORDER BY ratio DESC;

-- 确保数据均匀分布
CREATE TABLE analytics.sales_balanced
ORDER BY (region, order_id)
AS SELECT * FROM analytics.sales;
4. 写入优化
-- 批量写入(每批 10 万 -100 万条)
INSERT INTO analytics.sales (columns...)
SELECT * FROM temp_table
LIMIT 100000;

-- 使用背景合并优化
SYSTEM FLUSH LOGS;
SYSTEM STOP MERGES;
-- 执行大量插入
SYSTEM START MERGES;

-- 优化表配置
ALTER TABLE analytics.sales
MODIFY SETTINGS
    index_granularity = 8192,
    max_parts_in_total_block = 1000;
5. 监控与调试
-- 查看查询性能
SELECT
    query,
    query_duration_ms,
    read_rows,
    read_bytes,
    result_rows,
    memory_usage
FROM system.query_log
WHERE
    type = 'QueryFinish'
    AND query_duration_ms > 1000
ORDER BY query_duration_ms DESC
LIMIT 20;

-- 查看表大小和分区
SELECT
    table,
    engine,
    bytes_on_disk,
    parts,
    min_date,
    max_date
FROM system.tables
WHERE database = 'analytics';

-- 查看活跃查询
SELECT
    query_id,
    query,
    query_duration_ms,
    user,
    read_rows,
    read_bytes
FROM system.processes
ORDER BY query_duration_ms DESC;
6. 最佳实践清单
✅ 表设计
- 使用 MergeTree 系列引擎
- 合理选择 ORDER BY 排序键
- 分区键选择时间或高基数字段
- 避免过细的分区(建议每天一个分区)
✅ 查询优化
- 使用 PREWHERE 提前过滤
- 避免 SELECT *,只选择需要的字段
- 使用数组函数代替 JOIN
- 合理设置 LIMIT 减少数据传输
✅ 性能调优
- 调整 max_threads 参数
- 使用分布式表进行并行查询
- 定期 OPTIMIZE TABLE 合并数据
- 监控慢查询并优化
✅ 运维管理
- 设置 TTL 自动清理过期数据
- 定期检查数据分布
- 监控内存和磁盘使用
- 备份重要数据
—
总结
通过本文,我们深入了解了 ClickHouse 的列式存储原理和万亿级数据分析的实战技巧:
核心要点回顾:
- ✅ 列式存储优势:高压缩率、快速聚合查询
- ✅ 向量化执行:充分利用 CPU 并行计算
- ✅ 高性能聚合:GROUP BY、窗口函数、分位数计算
- ✅ 时序数据:日志分析、时间序列查询
- ✅ 宽表设计:减少 JOIN,提高查询效率
- ✅ 物化视图:预计算加速查询
- ✅ 性能优化:索引、查询、写入优化
- MySQL: 30-60 分钟
- PostgreSQL: 20-40 分钟
- ClickHouse: 5-15 秒 ⚡
- 实时数据分析平台
- 日志收集和分析系统
- 用户行为分析
- 物联网数据采集
- 金融科技风控
性能对比:
100 亿条数据聚合查询:
适用场景:
ClickHouse 以其卓越的列式存储性能和简洁的 SQL 语法,成为处理大数据量分析任务的理想选择。掌握这些技术和最佳实践,你将能够构建高效、可扩展的数据分析系统,轻松应对万亿级数据挑战!
—
*本文档最后更新时间:2026 年 04 月 27 日*
*作者:creator | 适用 ClickHouse 22.8+*
发表评论